Driverless Buses: The Specific Medium Trip Proposition: Luxury and Space

cold class cinemas recliners for luxury bus travel

In a previous post, I have explored the problems with short haul bus travel once driverless electric cars are a car ride service. There is a possibility that there may be a sweet spot between long-haul bus and short haul bus services. Bus companies can save significant costs by using driverless electric vehicles. If they use those savings to pamper passengers instead of cutting costs, they may well win the medium haul travel war.

The change of buses to driverless electric buses will make them more competitive with air travel. This is especially true over distances up to the 300-km mark. Most flights in Australia are longer than that, but there are plenty of short-haul flights in other countries. Once the distances get too long the faster speed of planes starts to take a competitive toll. Bus companies might be able to offer a significantly lower price to catch a driverless electric bus from Melbourne to Adelaide (727 km). The problem is that the flight is 1 hour and 20 minutes and the bus trip is around 10 hours depending on traffic. Even allowing for the delays of getting to the airport and moving through through security we are probably talking 3.5 hours versus 11 hours. Only people who cannot afford the fare are going to be taking that bus. Especially when you can get tickets that are sometimes close to competitive with the bus fare if you travel at the right times.

As an example of the medium length trip, let’s take the Sydney to Canberra flight which is 283 km. The flight time is 55 min, and a discount airfare is about $151 plus $25 for a taxi at the other end. Flights to Canberra are often more expensive than most other major city flights in Australia. This is due to the significant demand for flights during the weeks that the Federal Parliament sits. Between the Parliamentary sitting weeks, there are a limited number of flights. According to Greyhound Buses, the bus travel time is 3 hours and 30 minutes to 4 hours.

The reality is that while the flight time is 55 minutes the real travel time is by air is closer to 3 hours. You must be at the gate 30 minutes before the flight leaves. Airport traffic congestion means leaving the CBD at least an hour before that to avoid the risk of missing your flight. At the other end, you need 20 minutes to get a taxi and get to the CBD. Of course, there is some extra time for the bus as well, but it is minimal. So, let’s say it is 3 hours for the flight versus 4.5 hours for the bus. The current saver fare for Greyhound is A$38. If we use our previous assumptions on cost reductions for driverless electric buses (see The Coming Bus Apocalypse) we could get the price down to $23.

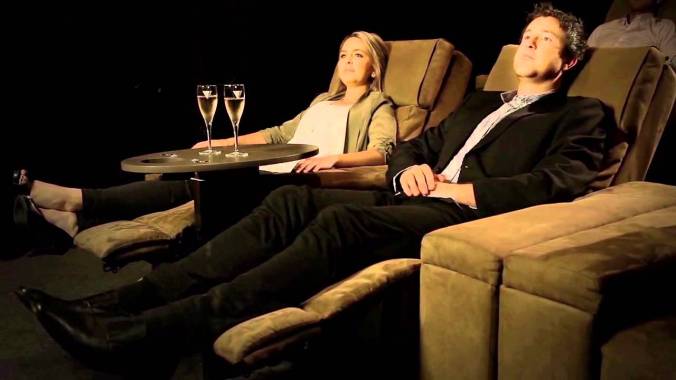
You might not be able to attract many more passengers by that cost reduction when the airfare plus taxi is already five times the current bus cost. That is a fair argument. What you can do though is take that price reduction and put it into more comfort and services. This produces a fantastic value proposition when the airlines are just trying to cram in more people. Imagine efficient workstations, Gold Class cinema type recliner chairs, and even nap pods for customers. What about soundproof gaming rooms so your children can game while you relax and take in a movie. Two adults and two kids for $152 for a luxury bus trip versus $625 on the plane sounds like a killer value proposition. The price might remain the same but comfort and experience are much better because the bus company can offer the same price but 60 or 70% more space.
Smaller buses with much better space than planes can come and pick you up from your house or business and take you in luxury. Eliminating the driver from a smaller bus has a much more significant impact per passenger than removing a driver from a larger bus.

Most of the current airline and bus transport models use the principle of maximising capacity utilisation. Most of the costs of driving a bus or flying a plane are fixed costs. Every extra passenger contributes an enormous percentage of their ticket price to the bottom line. Electric driverless buses are likely to head in the opposite direction for journeys where bus trips take not much time than flights.

It is a matter of changing the model where costs per passenger kilometre drive all thinking.

This will have significant implications for bus companies, and bus manufacturers. Bus companies will have to rethink routes and bus configurations. They will also have to rethink customer service. Bus manufacturers will have to rethink bus size, bus interiors, and bus power systems.

Paul Higgins

I am writing a book on autonomous vehicles with Dr Chris Rice . It is called Rise of the Autobots: How Driverless Vehicles will Transform our Economies and our Communities. Follow us here to see more excerpts as we write.

Come visit our website to see more of my work.

Advertisement

Electric Cars – Saving Real Money or Arbitrage Opportunity?

Electrek has reported an amazing set of numbers on a Tesla S:

A Tesla Model S hits 300,000 miles in just 2 years – saving an estimated $60,000 on fuel and maintenance

The vehicle is owned by Tesloop, a company that offers rides in Tesla vehicles.

A large part of this difference is due to the fact that the car is being used within an area that has extensive Tesla SuperChargers. So all the electricity is “free” (paid for as part of the purchase price of the vehicle). Also parts of the repairs and maintenance were largely paid for under the warranty. The powertrain warranty is for 8 years and includes unlimited mileage. This means that at the same annual usage rate the warranty would cover 1.2 million miles or 1.93 million kilometres.

The key question here is whether Tesla is losing money on this arrangement. If so, the savings are artificially inflated. The answer to part of that question is in the pricing models that Tesla introduced early in 2017. Before that date all Tesla S vehicles received free power on the Tesla Supercharger Network. After that date only the first 400 kWh per year are free. After that you get charged a fee for your power when charging . The fee varies between locations.

So there is no doubt that Tesla has been heavily subsiding the Tesloop operating costs. A smart business move to spot an arbitrage opportunity.

The 400 kWh is estimated to provide power for 1000 miles of driving (1609 kilometres). In Australia the current (sic) charge on the Tesla Supercharger is A$0.35/kWh.(https://www.tesla.com/en_AU/support/supercharging). so the energy cost per kilometre of driving is approximately 8.7 cents. This compares to my petrol Toyota Corolla Hatch at 8.1 cents per kilometre (combined urban/extra urban mileage claim of 6.7L/100km and fuel at  121 cents per litre). Fuel efficiency is worse in urban driving but the Tesla Superchargers are mainly for highway travel so that this is a fair comparison.

Two other comparisons bear looking at. In Illinois the charging rate is US$0.15 per kWh. This equals A$0.188 (RBA quoted exchange rate August 30th 2017) and changes the per kilometre cost to 4.7 cents.  Secondly, our current at home shoulder and off peak rates are A$0.1257, which reduces the per kilometre cost to 3.12 cents. Of course we would have to pay for a charging unit as well. If we amortise that cost then the total cost might be 4 cents per km. That is half my current fuel costs, or a saving of about $600 a year on 15,000 km.

If we use 4 cents as a reasonable figure then the cost difference for an electric vehicle travelling 100,000 km a year as a car ride service/taxi is $4,000. That is a significant advantage for an electric share vehicle over a fossil fuel vehicle. That number starts to really add up if you own 20,000 of them in a fleet ($80 million a year).

If we go to the non- fuel car costs. RACQ estimates that the private ownership costs of running a medium sized car in Australia are around 65-72 cents per kilometre. More than 50% of these costs are interest costs (about 8.2 cents) and depreciation costs (about 29.5 cents). Registration and insurance and other on road costs are at about 14.9 cents. This leaves about 7.5 cents for repairs and maintenance plus tyres after accounting for fuel costs. The vast majority of that being repairs and maintenance (median is about 7 cents). In the Tesloop case the scheduled repairs and maintenance costs were US$6,900 for 300,000 miles (482,802 km). This equates to A1.79 cents per kilometre. If we go back to my Toyota which has a fixed price service of A$480 a year then that costs is A3.2 cents per kilometre at 15,000 km per year. The reality is that I drive a little less so the cost is 3.7 cents.

If we go back to the RACQ numbers the Tesla Model S 75 version has fuel costs of 4.73 cents per kilometre. It also has maintenance costs of A8.91 cents. This seems high given the Tesla Loop experience but may just be a function of  the much higher mileage.

The Tesla S is a luxury vehicle and so its costs are likely to be higher than a standard vehicle. Lets look at the Chevy Bolt. In this analysis I have been helped by an excellent article by Steven Sinofsky at Learning by Shipping and Insideevs : Chevrolet Bolt Requires Almost No Maintenance For First 150,000 Miles.

The maintenance schedule (H/T Steven Sinofsky) for the Bolt is:

Chevy Bolt maintenance schedule Sinofsky

Insideevs estimates that if you do the very scant maintenance yourself the cost for maintenance for the first 150,000 miles (241,000 km) is US$150 (yes you read that right) while Steven says:

“Yep you read that correctly, during my entire three year lease there’s nothing for me to do. I never have to go to the dealer” – Steven Sinofsky

So one way or another routine maintenance is very low.

In terms of fuel efficiency the Bolt is rated at 238 miles (383 km) on a 60 kWh battery although city driving has a better range due to regenerative braking, and highway driving is poorer due to a poor drag coefficient.  This results in 6.38 km per kWh and if we use the off peak rate I pay then that is A1.97 cents per kilometre (note Steven was more conservative in his mileage calculations which work out to about A2.39 cents per km using my electricity costs).

This is a lot of figures so as a summary I have made up a small table:

Fuel Costs Maintenance Costs Total
Tesloop Tesla S 0 1.79 1.79
Toyota Corolla Hatch (Mine) 8.1 3.7 11.8
Tesla S (RACQ) 4.7 8.91 13.61
Luxury Vehicle (Ave RACQ) 7.06 10.2 17.26
Chevy Bolt (first 60,000km – but generally representative) 1.97 0 1.97

Now I know that I have not made a fair comparison between the Bolt and the Tesla S. In part because they are completely different vehicles, and because I have only included routine maintenance servicing for the Bolt.  There will be non -routine costs in the maintenance costs. The actual costs of those the owner will be in part determined by warranty systems. The RACQ figures appear to include a capped servicing arrangement with Telstra.

What we can say is that there are significant operating costs for the new electric vehicles, as compared to standard ICE vehicles. Even if we add in the Tesloop Tesla S maintenance costs as an estimate for the Bolt’s costs, the Chevy Bolt’s operating cost for fuel and maintenance is still only 3.76 cents per kilometre, compared to my Toyota costs of 11.8 cents. Even though I have only included my fixed costs servicing which is well below the costs shown in the RACQ figures.
 
That comparison is also unfair as the costs associated with the Tesla S are high due to its luxury model status. You can see the details of the repairs and maintenance receipts by going to : Tesla Model S Hits 300,000 Miles with less than $11,000 maintenance costs  and registering for their Google Docs page. These include warranty repairs done at no cost. I was unable to reconcile the costs to the article description as some costs appear to be missing but what is in there is in the following table:
Date Item Cost
18/08/2016 Replace 12V battery 171.33
24/10/2016 replace brake pads and rotors 1759.42
4/11/2016 Right Rear Door handle 961.96
21/11/2016 left front door handle 962.18
20/02/2017 wheel liner, rear diffuser, front aero shield, water ingress on headlights 2176.2
7/03/2017 Air conditioner , other pages to receipt are missing 2800.12
15/03/2017 Air conditioner, passenger door handle 656.64
Total 9487.85

As you can see the majority of the maintenance costs excluding the issue with the headlights and brake replacements related to the air conditioner and door handles. Some of these are likely to be costs associated with the luxury/technology parts of the doors, and early model issues. I would expect that costs for a standard production model would be much lower.

The point of all this analysis is work for our book to look at adoption timelines and business models for electric and autonomous vehicles.

In this case it is the headline number of how much it takes to run your car. That is because people get this in their face every week whereas the main costs of finance and depreciation are more removed from their experience. Once we move to the full question of costs we have to look at those more closely. we will do that in the next few days. Then we have to look at fleet options versus personal ownership.

We will do some more sophisticated modelling as we firm up the assessment for the book.

I am writing a book on autonomous vehicles with Dr Chris Rice of the University of Texas Austin. It is called Rise of the Autobots: How Driverless Vehicles will Transform our Economies and our Communities. Stay tuned for more excerpts as we finalise the book.


Electric Cars and the Legacy Issue

Chris Rice and I are currently writing a book on the rise of autonomous vehicles and their widespread effects across our economies (entitled Rise of the Autobots: How Driverless Vehicles will change our Societies and our Economies). One of the keys to looking at what these changes might mean and the rate at which they will occur is the speed of adoption speed of electric cars and autonomous vehicles combined together.

There have been lots of excited announcements about electric cars over the last few months including:

India to make every single car electric by 2030 in bid to tackle pollution that kills millions
The Electric-Car Boom Is So Real Even Oil Companies Say It’s Coming
When Will Electric Cars Go Mainstream? It May Be Sooner Than You Think

The reality is that the adoption of electric cars will have several bottlenecks including but not limited to:

  • Battery availability.
  • Production capacity for manufacturing.
  • The reluctance of people to adopt the technology until they are completely sure that the charging issues and the range issue have been adequately dealt with.
  • The long-term nature of the turnover of the vehicle fleet.

Both battery production and electric car production are ramping up but the last point is very important when we start looking at the critical mass needed to disrupt a range of industries, including petrol stations and their supply chains, maintenance and repair systems, and the electric power grid. Even when it becomes a sensible economic decision to purchase a new electric car over an internal combustion engine (ICE) powered car, someone with a 7 year old vehicle is not going to immediately changeover. This is both due to the capital nature of the change and the fact that if electric cars are more economical than ICE cars the resale value of second hand ICE cars will fall dramatically, reducing the interest and capacity of people to purchase a new vehicle (if purchase is the model). This will be exacerbated if the new electric vehicles also have significant advantages in autonomy.

To illustrate this issue we took a look at the vehicle fleet in New South Wales in Australia If we look at the statistics at the end of the fourth quarter in 2016 it gives us a snapshot of the vehicle legacy issue. The following graph shows the year of manufacture for light vehicles registered in NSW at the end of 2016. The majority are passenger vehicles:

light vehicle registrations in NSW 2016 Q4

Source: http://www.rms.nsw.gov.au/about/corporate-publications/statistics/registrationandlicensing/tables/table113_2016q4.html  – accessed July 24th 2017

While the 2016 manufactured vehicles are under-represented in this graph as many 2016 vehicles are registered in 2017, it nevertheless gives a clear picture of the ownership structure of light vehicles. If we look deeper in the data we see that 20.1% of the registered light vehicles are manufactured prior to 2001.

If we look at heavy vehicles we get a similar picture albeit with different percentages:

heavy vehicle registrations in NSW 2016 Q4

There are some differences in the data between light and heavy vehicles:

  • The first is that there are significantly more 2007 heavy vehicles registered than any other year. This probably relates to GFC issues.
  • The second is that the heavy vehicle curve is lower than the light vehicle curve. This probably reflects a pattern of use where heavy vehicles are sold into a secondary market that will discount vehicles significantly if the economic model is significantly different than the new vehicle one, extending the useful economic life of the vehicles. This means that the percentage of total registered heavy vehicles prior to 2001 is 34.2%, much higher than light vehicles.
  • The third is that there are many more vintage models in the light vehicle category, reflecting the motoring enthusiast and restoration market. So there are 3,379 registered light vehicles manufactured 1900-1949, but only 21 heavy vehicles for the same period.

A very simplistic look at this data says that even if every vehicle sold new in Australia was electric from say 2025 was an electric car, and the purchase patterns remained stable after 5 years we would have between 31% and 40% electric light vehicles on the road and in 10 years it would be somewhere between 50 and 60%. This pattern is highly unlikely and so the real adoption rates will be well short of that. Every year that the purchase pattern is 50% electric and 50% ICE will slow the transition as those ICE cars will be on the road for a long time.

This adoption cycle is complicated by our view that increasing automation will result in more fleet ownership models, and shared car rides, reducing the total sales of new vehicles. While this means that battery and electric car manufacturing do not have to ramp up as much to get to 100% of new sales it changes the adoption curve.

Now both those simplistic analyses assume the normal pattern of car purchases and ownership will remain in place. That is also unrealistic. All we do know is that the adoption rates will be relatively slow because of the legacy issues and the turnover of the vehicle fleet as a whole. Cars are not smartphones. We will be doing some more modelling on the possible scenarios over the next few weeks. Follow us here if you want to see them and help us think through the changes.


Featured Image is from :

Top 8 Secrets for Competitive Electric cars-Tips for Auto Manufacturers by Ameen Shageer


Re-Purposed Electric Car Batteries and Its Effects on Electric Car Adoption/Driverless Car Adoption

Last night I attended the Churchill Club event in Melbourne on the future of batteries. There was a great panel presenting and the discussions covered a range of battery technologies, including Ecoult which is commercialising the CSIRO ultracapacitor technology for lead acid batteries.

In particular I was interested in the presentation by Relectrify CEO and Co-Founder Valentin Muenzel who talked about Relectrify’s mission to use electric car batteries that were no longer useful in energy storage applications. This was interesting because as part of my research for a book that Chris Rice and I are writing on the future of driverless cars I had been looking at the adoption rates of electric cars as part of the rise of driverless cars. In that research I had come across an assessment by Ark Investments that had calculated the net present value of an electric car battery in a specific energy storage scenario as shown in the following table:

Ark Invest battery depreciation table

source: https://ark-invest.com/research/ev-batteries-value – accessed June 20th 2017

The basic principle is that while a battery in an electric car might have its performance degrade to a point where it is no longer useful for driving, that battery will still have significant storage capacity (think about your phone battery after 18 months – it still works but its capacity is reduced).  If you can buy that battery cheaply and adapt it to storage use then you have a cost effective solution.

Of course the Net Present Value calculation in the table is for a specified energy reserve use which has a higher price, and nobody buys an asset for its Net Present Value otherwise all you do is get your money back over time. In discussions with Valentin he told me that without giving away commercial secrets the model for them is about 50% of the value of a new battery. This is important because the cost of new car batteries is falling. An analysis of battery prices by Bloomberg New Energy Finance in January showed the pace of that change:

battery prices falling fast from Bloomberg

source: https://www.bloomberg.com/news/articles/2017-01-30/tesla-s-battery-revolution-just-reached-critical-mass  

Now this is the price of the battery itself which is not the same as an installed battery system but the progress has been amazing, and mirrors what we have seen in solar energy. No great basic technology breakthrough, but significant technology improvements driven by the cost learning curve. In a separate report Mckinsey has stated that electric vehicle batteries fell to $227/kWh in 2016 with Tesla claiming to be below $190 per kWh (Electric vehicle battery cost dropped 80% in 6 years down to $227/kWh – Tesla claims to be below $190/kWh) Rumours have also circulated that Tesla has got the battery costs down to $125 per kWh (Tesla is now claiming 35% battery cost reduction at ‘Gigafactory 1’ – hinting at breakthrough cost below $125/kWh) although the truth of that remains to be seen. There is no doubt about the rapid pace of changes occurring, just the quantum of that change.

Valentin and I also discussed the model for autonomous vehicles given that a fleet model or a car sharing model means that cars would travel far more kilometres in a year. For an electric car this means that the battery will reach its degradation limit more quickly as the battery would be charged and discharged more often. Interestingly for Valentin this meant that the battery would be worth more for repurposing, because outside of the energy capacity the battery still retained, its relative newness means the technology is likely to be more advanced, and safety and physical deterioration characteristics would be much better.

Given that storage is likely to become far more important in the future given changes in the energy generation mixes around the world it puts a slightly different complexion on the costs of electric cars. It is our view that the end game for driverless cars is mass fleets supplied as a service with hardly anybody owning a car. If electric car batteries only last 3 years in shared driverless vehicle but have significant re-sale value it lowers the lifetime cost of a kilometre travelled and therefore accelerates us to the point where the cost of running an electric car is lower than running a fossil fuel car. Lifetime cost factors less into individual car ownership decisions but if you own 50,000 cars in a mass fleet in a highly competitive market it becomes it becomes a much more important factor. This changes adoption rates and also the balance between fossil fuel and electric cars.

The effects of this will be lumpy as Valentin advised that different batteries have different degrees of difficulty for repurposing as stationary storage. This is related to the original design decisions made for the battery technology which were originally made with the purpose of electric cars in mind, not stationary storage. For example apparently Tesla has stated that their car batteries will not be repurposed and that is due to the design constraints in their battery technology.

A note of caution:

In a discussion with John Wood (CEO of Ecoult) he quite rightly warned me to be careful of the public statements of battery manufacturers and suppliers on their lifetime use. Given that we are talking about changes in technology and lifetimes of 10-15 years which are therefore untested in the real world, those are wise words.


Image credit: The featured image is from http://www.relectrify.com/