Chris Rice and I are currently writing a book on the rise of autonomous vehicles and their widespread effects across our economies (entitled Rise of the Autobots: How Driverless Vehicles will change our Societies and our Economies). One of the keys to looking at what these changes might mean and the rate at which they will occur is the speed of adoption speed of electric cars and autonomous vehicles combined together.
There have been lots of excited announcements about electric cars over the last few months including:
India to make every single car electric by 2030 in bid to tackle pollution that kills millions
The Electric-Car Boom Is So Real Even Oil Companies Say It’s Coming
When Will Electric Cars Go Mainstream? It May Be Sooner Than You Think
The reality is that the adoption of electric cars will have several bottlenecks including but not limited to:
- Battery availability.
- Production capacity for manufacturing.
- The reluctance of people to adopt the technology until they are completely sure that the charging issues and the range issue have been adequately dealt with.
- The long-term nature of the turnover of the vehicle fleet.
Both battery production and electric car production are ramping up but the last point is very important when we start looking at the critical mass needed to disrupt a range of industries, including petrol stations and their supply chains, maintenance and repair systems, and the electric power grid. Even when it becomes a sensible economic decision to purchase a new electric car over an internal combustion engine (ICE) powered car, someone with a 7 year old vehicle is not going to immediately changeover. This is both due to the capital nature of the change and the fact that if electric cars are more economical than ICE cars the resale value of second hand ICE cars will fall dramatically, reducing the interest and capacity of people to purchase a new vehicle (if purchase is the model). This will be exacerbated if the new electric vehicles also have significant advantages in autonomy.
To illustrate this issue we took a look at the vehicle fleet in New South Wales in Australia If we look at the statistics at the end of the fourth quarter in 2016 it gives us a snapshot of the vehicle legacy issue. The following graph shows the year of manufacture for light vehicles registered in NSW at the end of 2016. The majority are passenger vehicles:
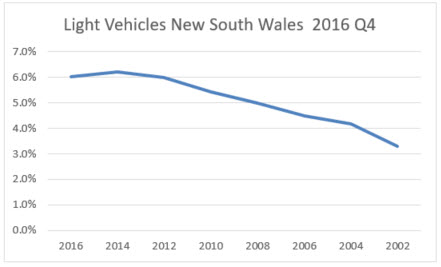
Source: http://www.rms.nsw.gov.au/about/corporate-publications/statistics/registrationandlicensing/tables/table113_2016q4.html – accessed July 24th 2017
While the 2016 manufactured vehicles are under-represented in this graph as many 2016 vehicles are registered in 2017, it nevertheless gives a clear picture of the ownership structure of light vehicles. If we look deeper in the data we see that 20.1% of the registered light vehicles are manufactured prior to 2001.
If we look at heavy vehicles we get a similar picture albeit with different percentages:

There are some differences in the data between light and heavy vehicles:
- The first is that there are significantly more 2007 heavy vehicles registered than any other year. This probably relates to GFC issues.
- The second is that the heavy vehicle curve is lower than the light vehicle curve. This probably reflects a pattern of use where heavy vehicles are sold into a secondary market that will discount vehicles significantly if the economic model is significantly different than the new vehicle one, extending the useful economic life of the vehicles. This means that the percentage of total registered heavy vehicles prior to 2001 is 34.2%, much higher than light vehicles.
- The third is that there are many more vintage models in the light vehicle category, reflecting the motoring enthusiast and restoration market. So there are 3,379 registered light vehicles manufactured 1900-1949, but only 21 heavy vehicles for the same period.
A very simplistic look at this data says that even if every vehicle sold new in Australia was electric from say 2025 was an electric car, and the purchase patterns remained stable after 5 years we would have between 31% and 40% electric light vehicles on the road and in 10 years it would be somewhere between 50 and 60%. This pattern is highly unlikely and so the real adoption rates will be well short of that. Every year that the purchase pattern is 50% electric and 50% ICE will slow the transition as those ICE cars will be on the road for a long time.
This adoption cycle is complicated by our view that increasing automation will result in more fleet ownership models, and shared car rides, reducing the total sales of new vehicles. While this means that battery and electric car manufacturing do not have to ramp up as much to get to 100% of new sales it changes the adoption curve.
Now both those simplistic analyses assume the normal pattern of car purchases and ownership will remain in place. That is also unrealistic. All we do know is that the adoption rates will be relatively slow because of the legacy issues and the turnover of the vehicle fleet as a whole. Cars are not smartphones. We will be doing some more modelling on the possible scenarios over the next few weeks. Follow us here if you want to see them and help us think through the changes.
Featured Image is from :
Top 8 Secrets for Competitive Electric cars-Tips for Auto Manufacturers by Ameen Shageer
